
Ixodes ricinus models
1. Simulating the seasonal cycle
Abstract
Ticks of the species Ixodes ricinus (L.) are the major vectors for tick-borne diseases in Europe. The aim of this study was to quantify the influence of environmental variables on the seasonal cycle of questing I. ricinus. Therefore, an 8-year time series of nymphal I. ricinus flagged at monthly intervals in Haselmühl (Germany) was compiled. For the first time, cross correlation maps were applied to identify optimal associations between observed nymphal I. ricinus densities and time-lagged as well as temporal averaged explanatory variables. To prove the explanatory power of these associations, two Poisson regression models were generated. The first model simulates the ticks of the entire time series flagged per 100 m2, the second model the mean seasonal cycle. Explanatory variables comprise the temperature of the flagging month, the relative humidity averaged from the flagging month and 1 month prior to flagging, the temperature averaged over 4-6 months prior to the flagging event and the hunting statistics of the European hare from the preceding year. The first model explains 65% of the monthly tick variance and results in a root mean square error (RMSE) of 17 ticks per 100 m2. The second model explains 96% of the tick variance. Again, the accuracy is expressed by the RMSE, which is 5 ticks per 100 m2. As a major result, this study demonstrates that tick densities are higher correlated with time-lagged and temporal averaged variables than with contemporaneous explanatory variables, resulting in a better model performance.
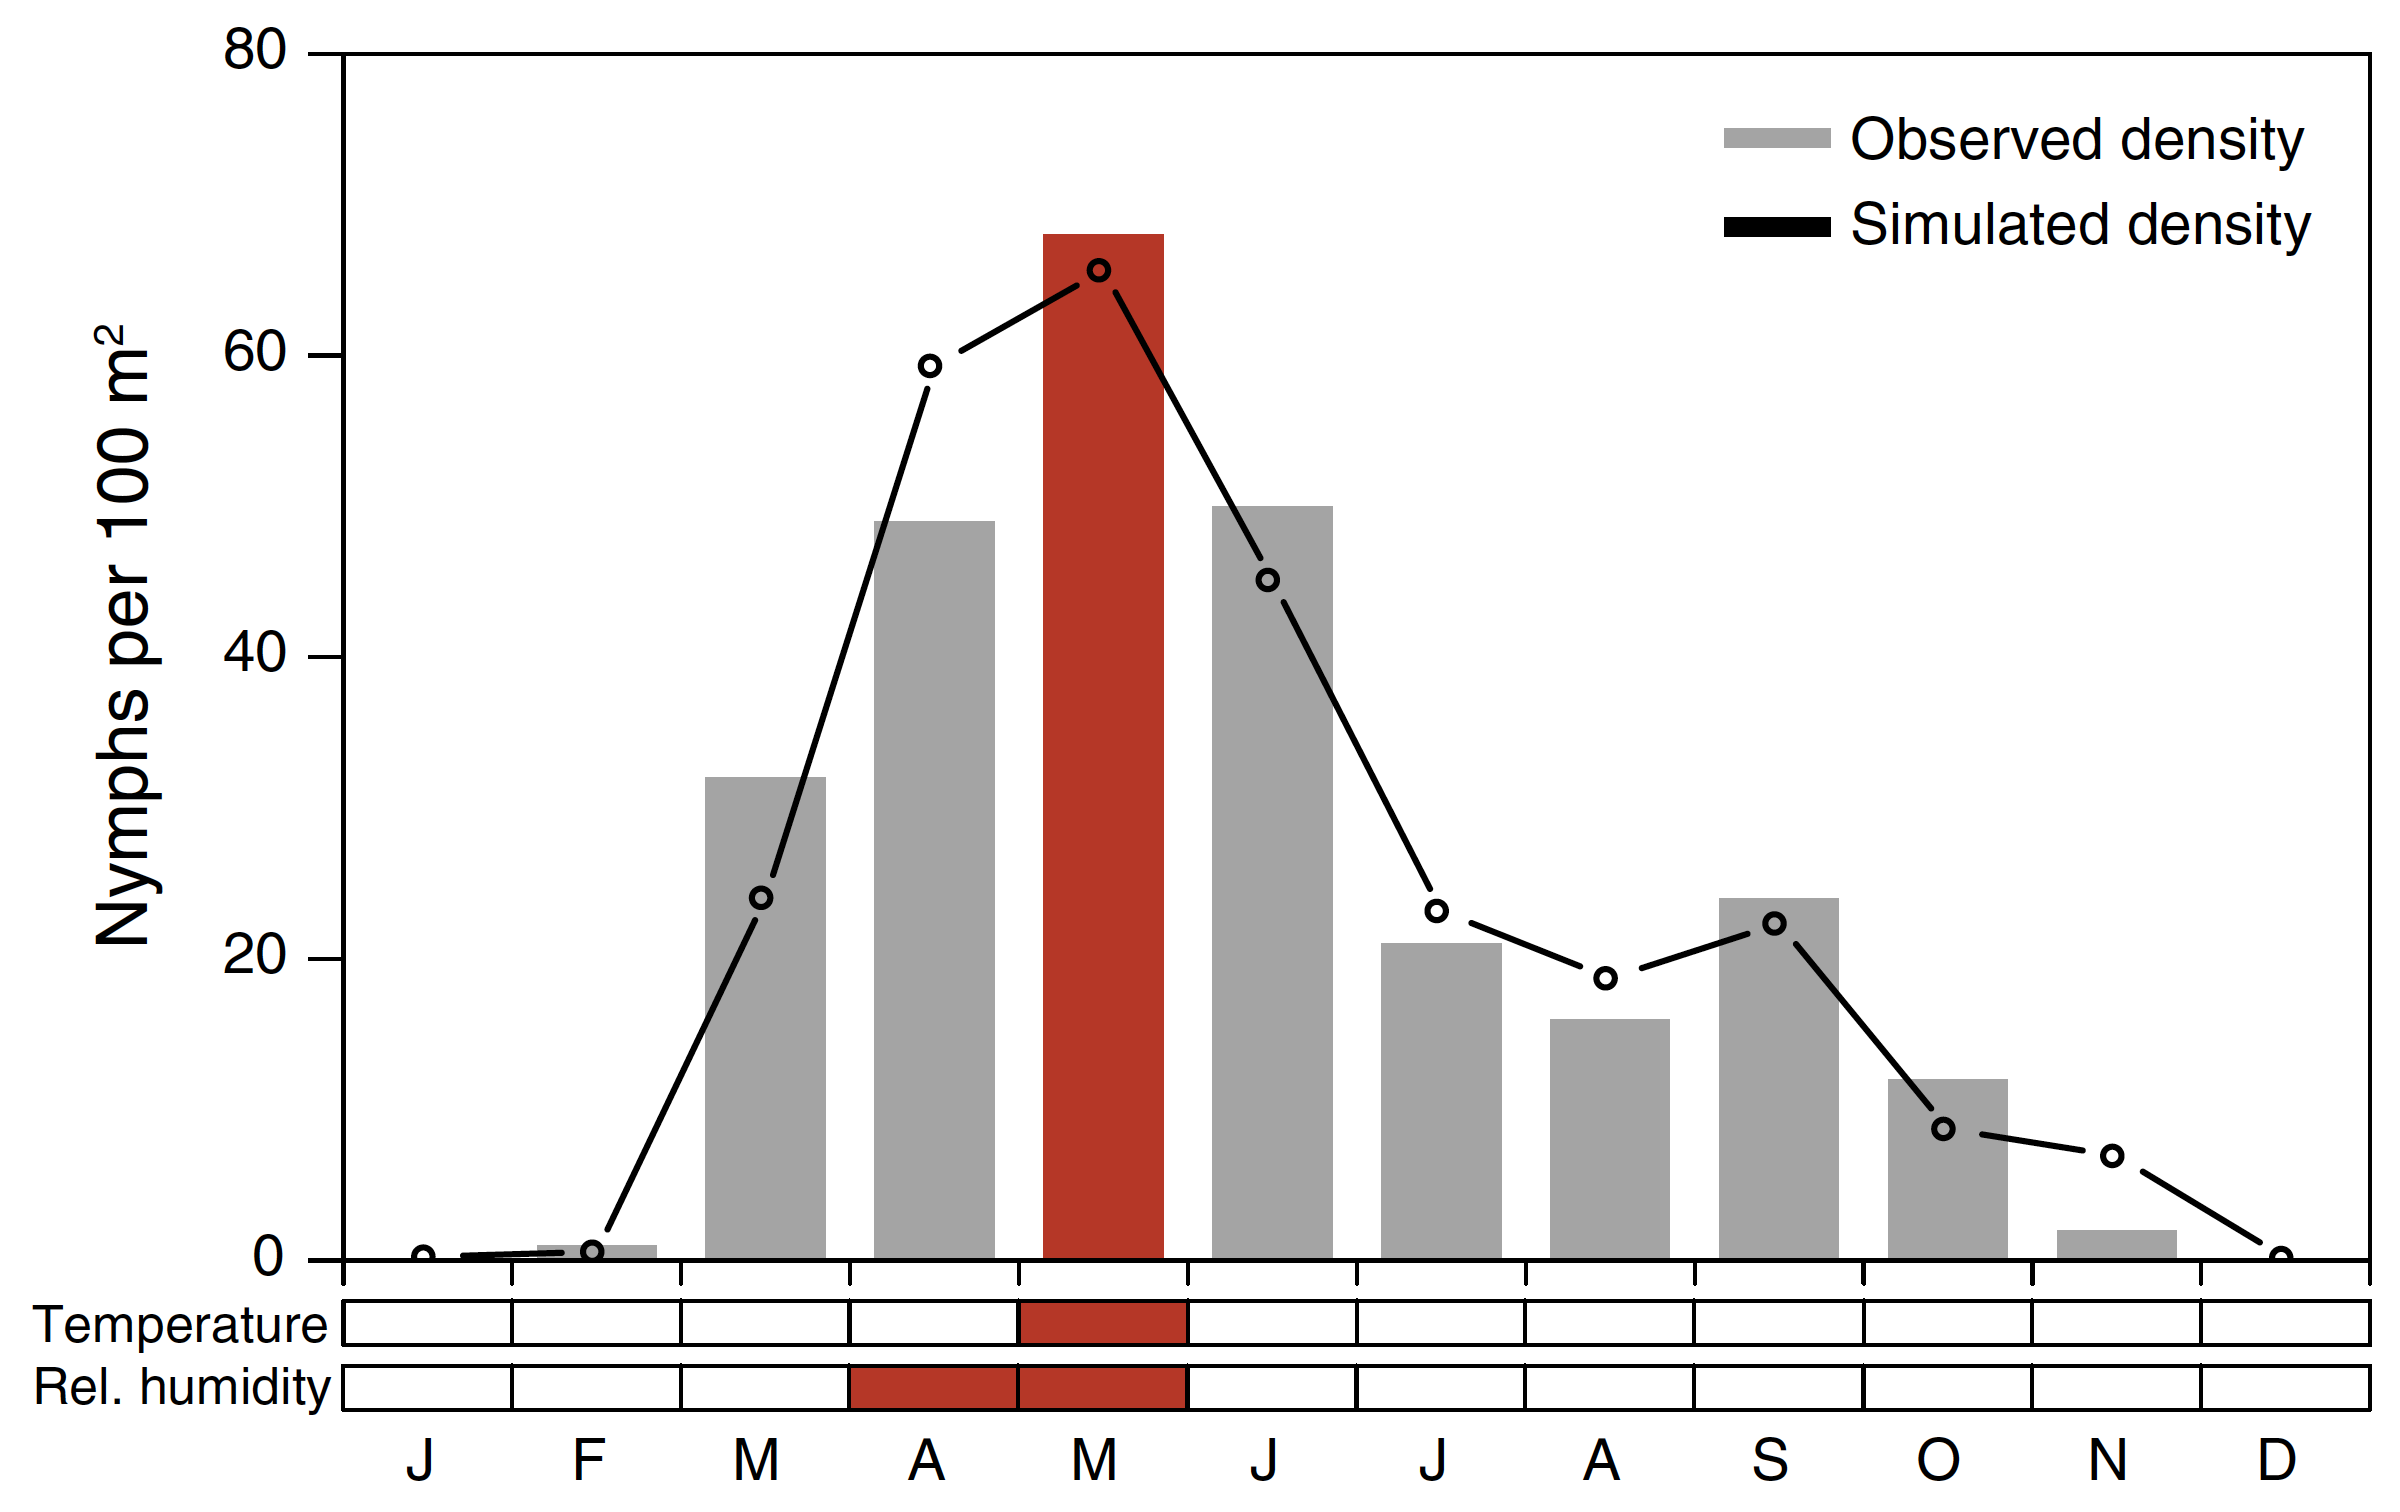
Mean monthly nymphal tick density observed (grey bars) vs. modelled (line). To illustrate the climatic variables determining the density in May, the mean temperature in May as well as the mean relative humidity from April to May are highlighted in red.
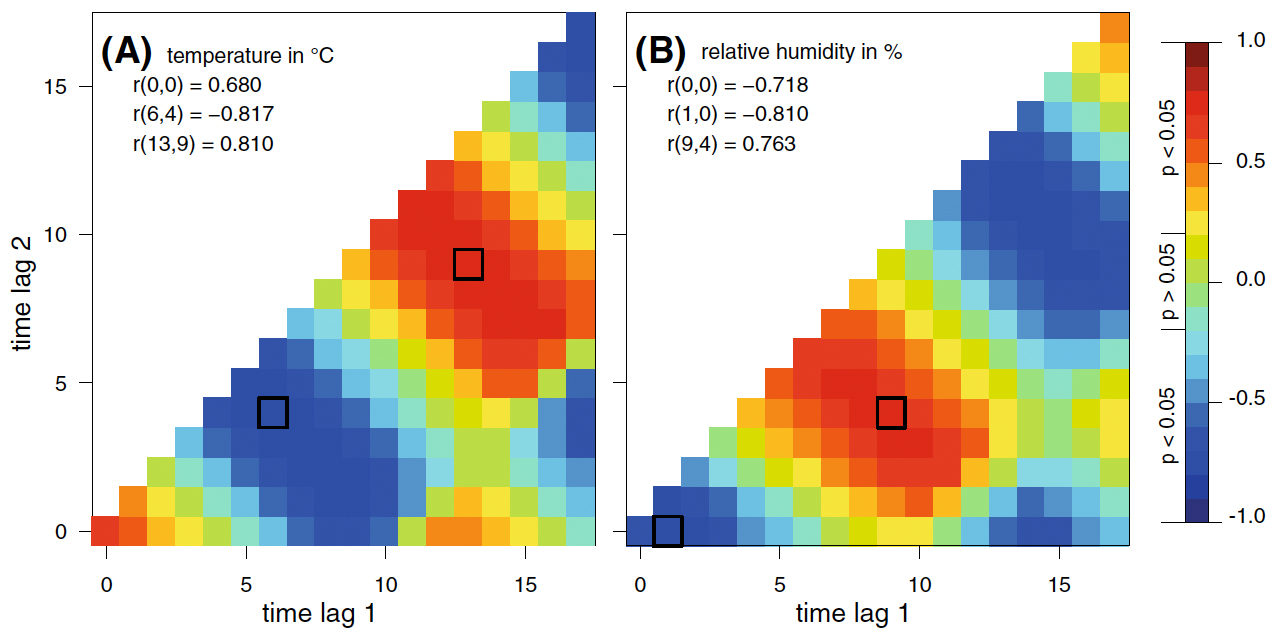
Cross correlation maps (CCMs) are used to find the maximum correlation between time-lagged tick density and predictor variables. CCMs of the monthly time series of nymphal ticks versus both (A) temperature in °C and (B) relative humidity in %.
R Code

 ticks2009-2016.txt
climate2007-2016.txt
ticks2009-2016.txt
climate2007-2016.txt
The model was developed using the R statistical computing environment (R Development Core Team, 2017).
References
Brugger, K., M. Walter, L. Chitimia-Dobler, G. Dobler, and F. Rubel, 2017:
![]() Seasonal cycles of the TBE and Lyme borreliosis vector Ixodes ricinus modelled by time-lagged and interval-averaged predictors.
Seasonal cycles of the TBE and Lyme borreliosis vector Ixodes ricinus modelled by time-lagged and interval-averaged predictors.
Exp. Appl. Acarol., 73, 439-450. (doi: 10.1007/s10493-017-0197-8)